Admitted Students: Class of 2027
Emory University has many ways to understand the academic strength and diversity of its applicants. Here is a snapshot of the middle 50% of the admitted Class of 2027, students who would enroll in fall 2023.
Date of record: August 2023
*Test Optional: Emory University is test optional for the 2023 admission cycle. Not all applicants choose to submit test scores when applying. Testing statistics are taken from applicants who submitted test scores with their application.
Emory College

ADMITTED
3.89 / 4.00
GPA (unweighted)
33–35
ACT
720-770
SAT: Evidence-Based Reading and Writing
750-790
SAT: Math
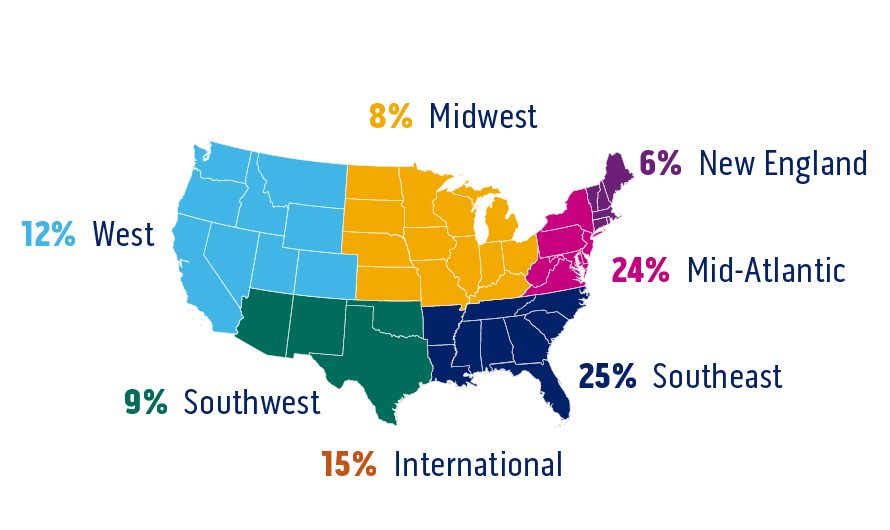
GEOGRAPHIC DISTRIBUTION
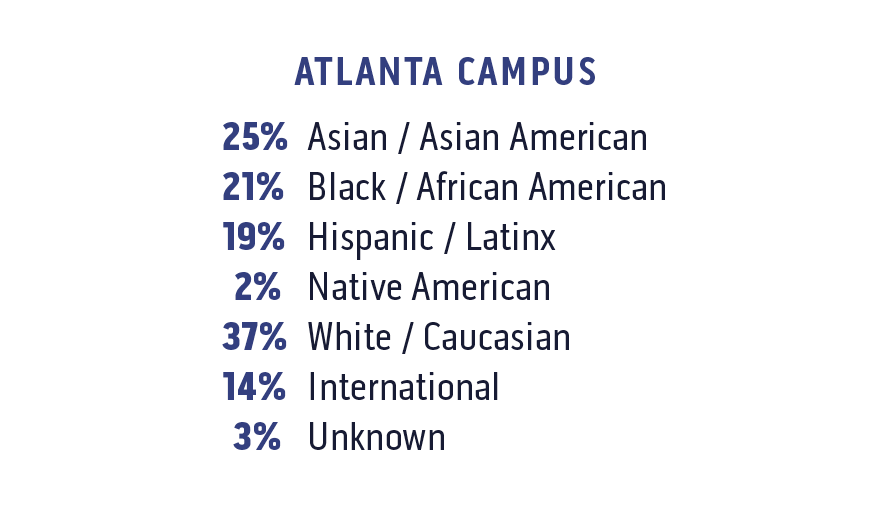
SELF-IDENTIFIED RACE/ETHNICITY
Students may identify with more than one race
Oxford College
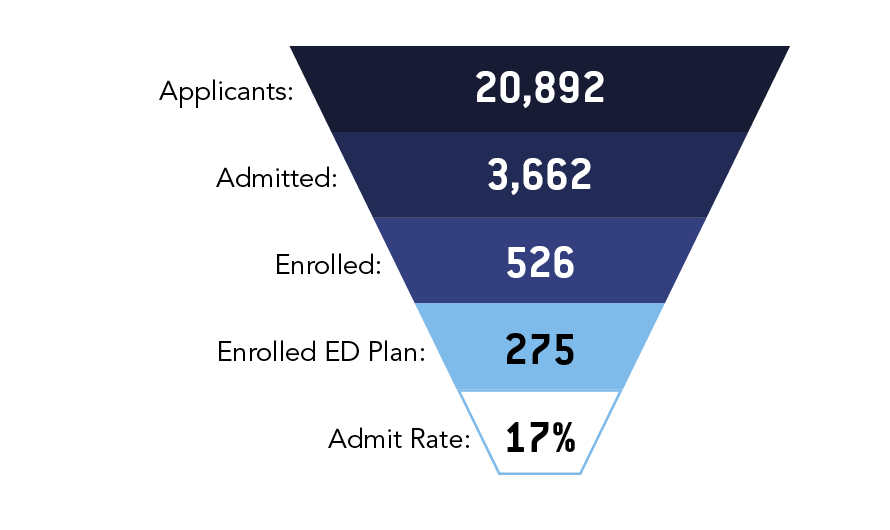
Applicants / Admitted / Enrolled
3.88 / 4.00
GPA (unweighted)
33–35
ACT
720-770
SAT: Evidence-Based Reading and Writing
750-790
SAT: Math
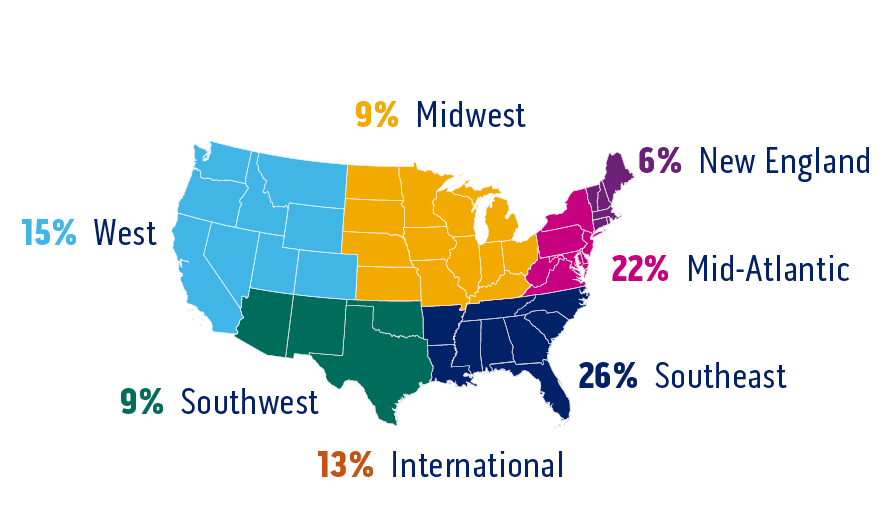
GEOGRAPHIC DISTRIBUTION
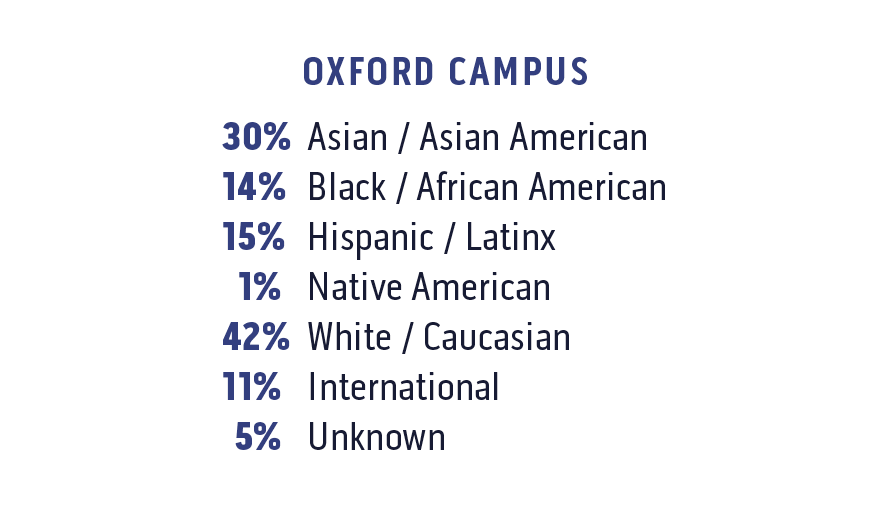
SELF-IDENTIFIED RACE/ETHNICITY
Students may identify with more than one race